From raw data to decisions.
Two layers. CS Engine collects and structures your sensor data. CS Monitor turns it into decisions.
DECISION LAYER
CS Monitor
One monitoring platform, configured for the asset you operate.
HYDROGEN FLEETS
CS Monitor MEGC
Available
Cycles, capacity and event log per vessel, health score and compliance evidence for MEGC trailers.
INFRASTRUCTURE
CS Monitor Structures
In development
Live load monitoring for bridges, tunnels, lock gates, dikes and steel structures, with CS FSR sensors.
YOUR ASSET
CS Monitor Custom
On request
Another asset type, another set of indicators. We configure CS Monitor on top of CS Engine for your case.
CS MONITOR · AVAILABLE
CS Monitor MEGC
Built for MEGC hydrogen fleets. One view per trailer, one card per vessel.
- A reference for every vessel. The factory proof test is each COPV's fingerprint. At commissioning, a zero check confirms nothing happened in between.
- Your telematics, our sensors. Pressure and temperature come from your existing telematics platform. CS Monitor computes the hydrogen mass and cross-checks the station's figures.
- Built around the standards your vessels live by. EN 17339, ISO 11119, ISO 10961, UN ECE R134, EN 12245.
CS Monitor MEGC: three levels
WHAT'S ON BOARD
CS Monitor
Cycle count, capacity, fingerprint, event log.
WHAT'S COMING
CS Predict
Health score, cycle gauge with estimated residual cycles, estimated life, incidents at vessel level. Predictive models are calibrated per vessel type on cycling and burst test data.
WHAT YOU CAN PROVE
CS Certify
Compliance status and evidence report. Our aim is continuous certification in place of periodic requalification.
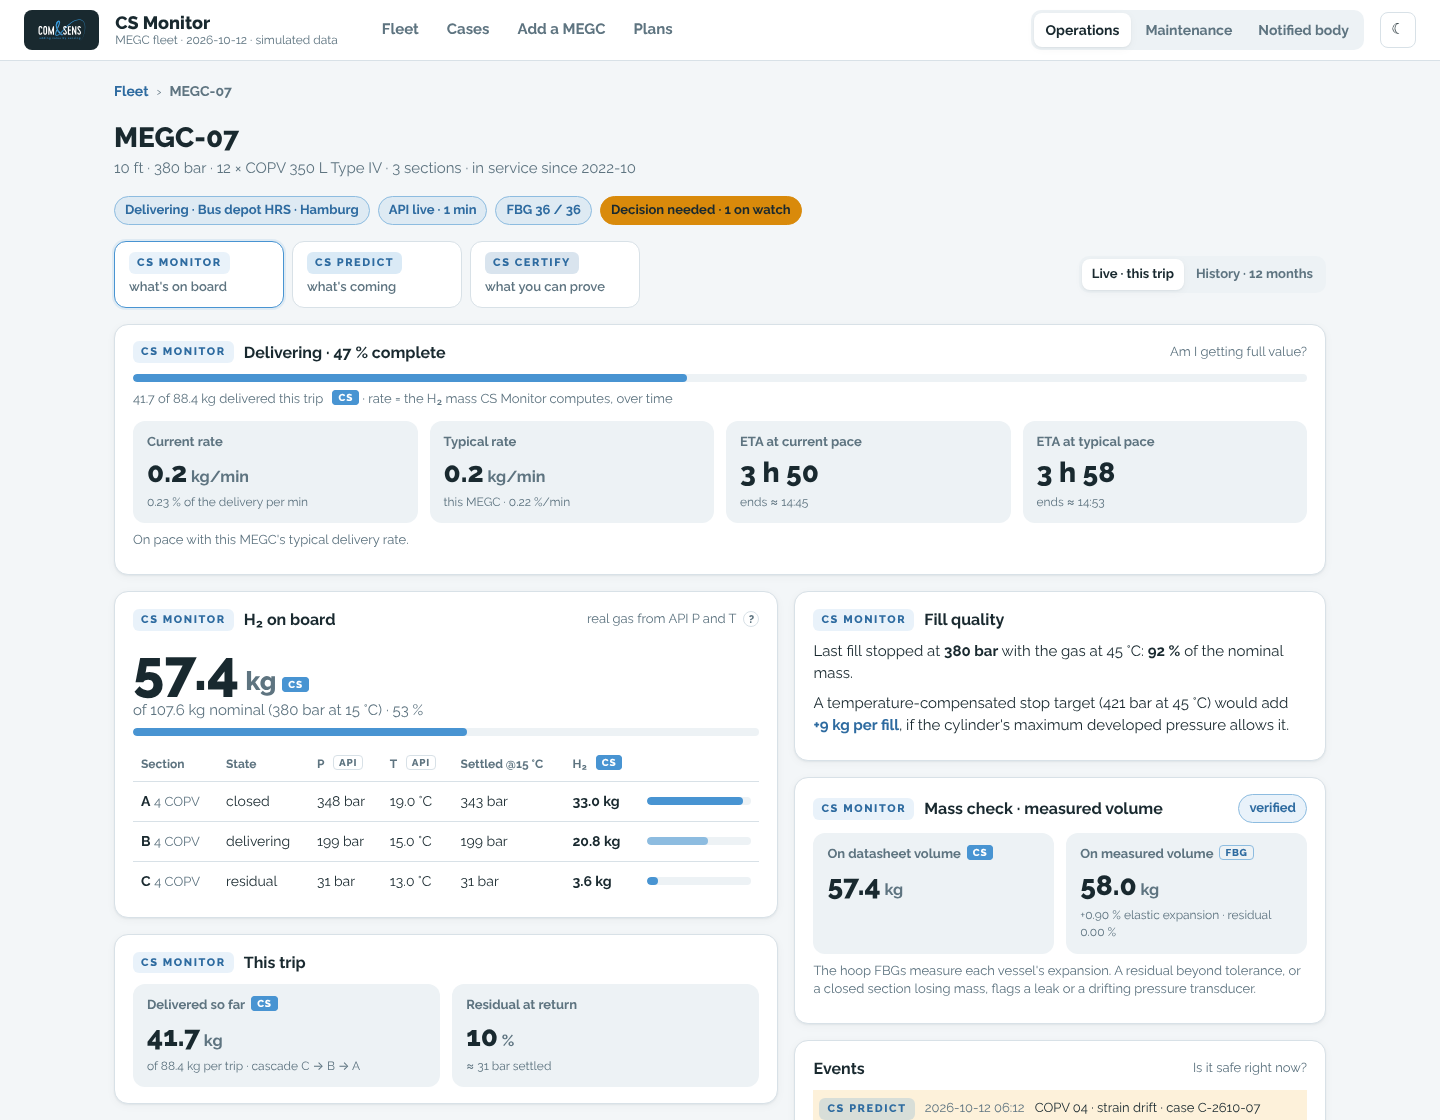
One MEGC: hydrogen on board, delivery progress, fill quality.
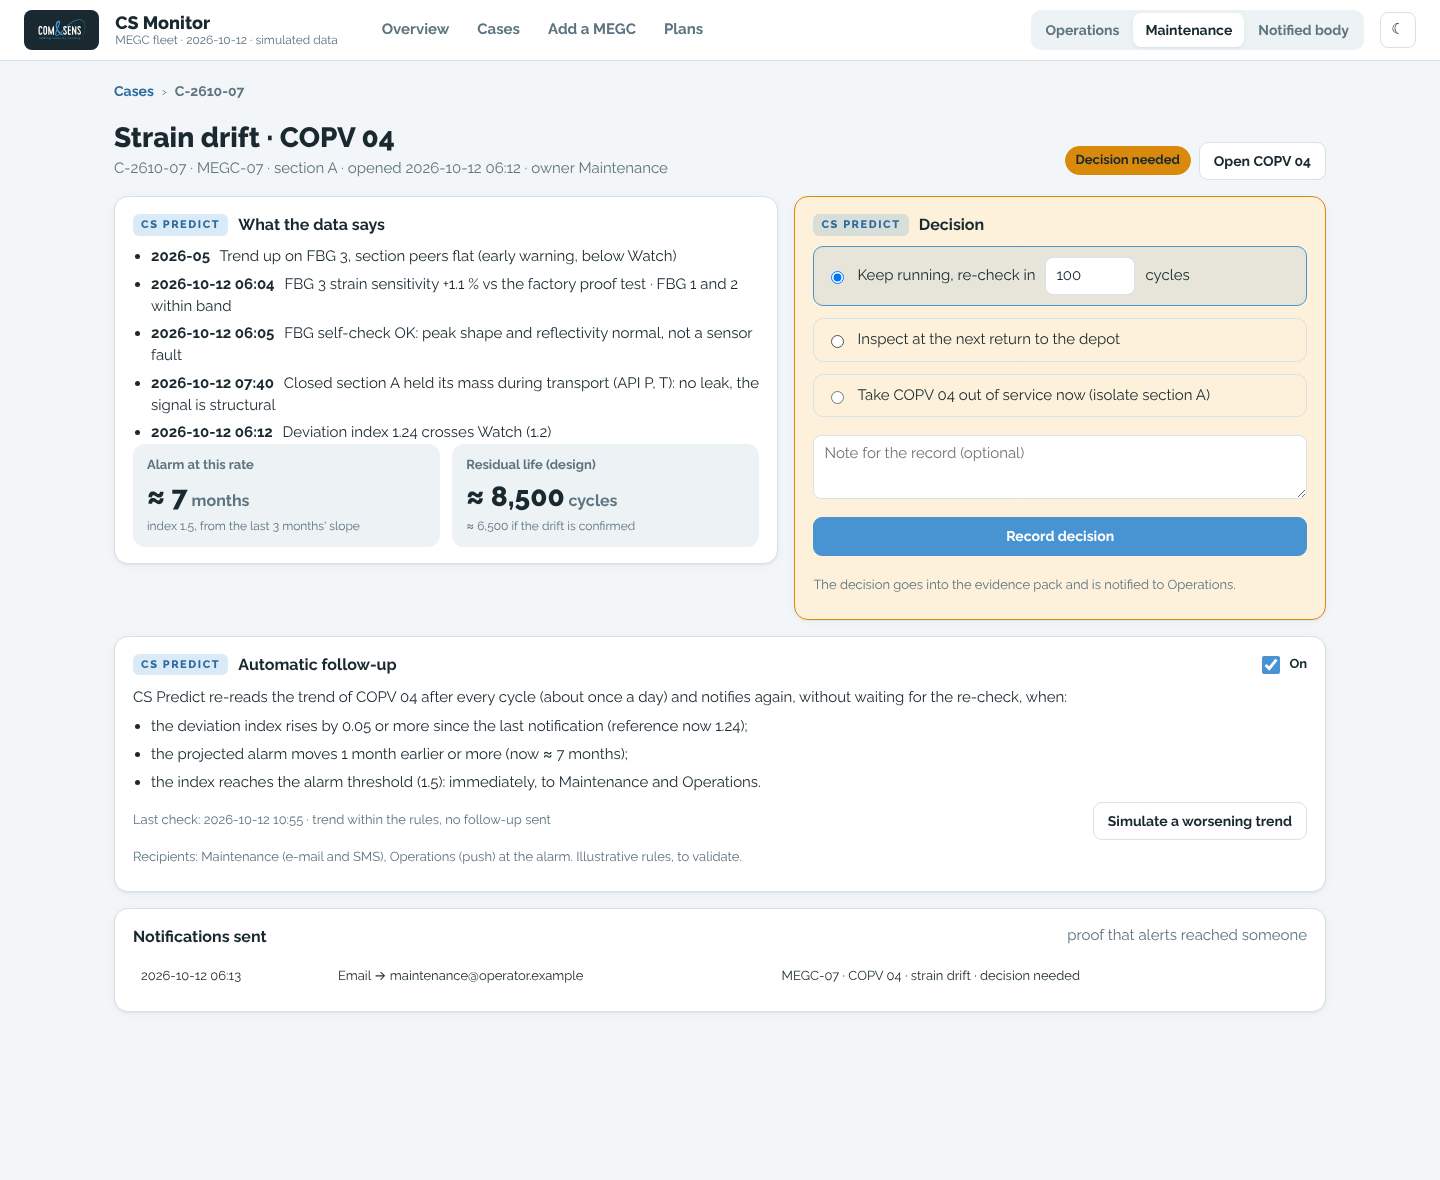
A case: what the data says, and the decision it calls for.
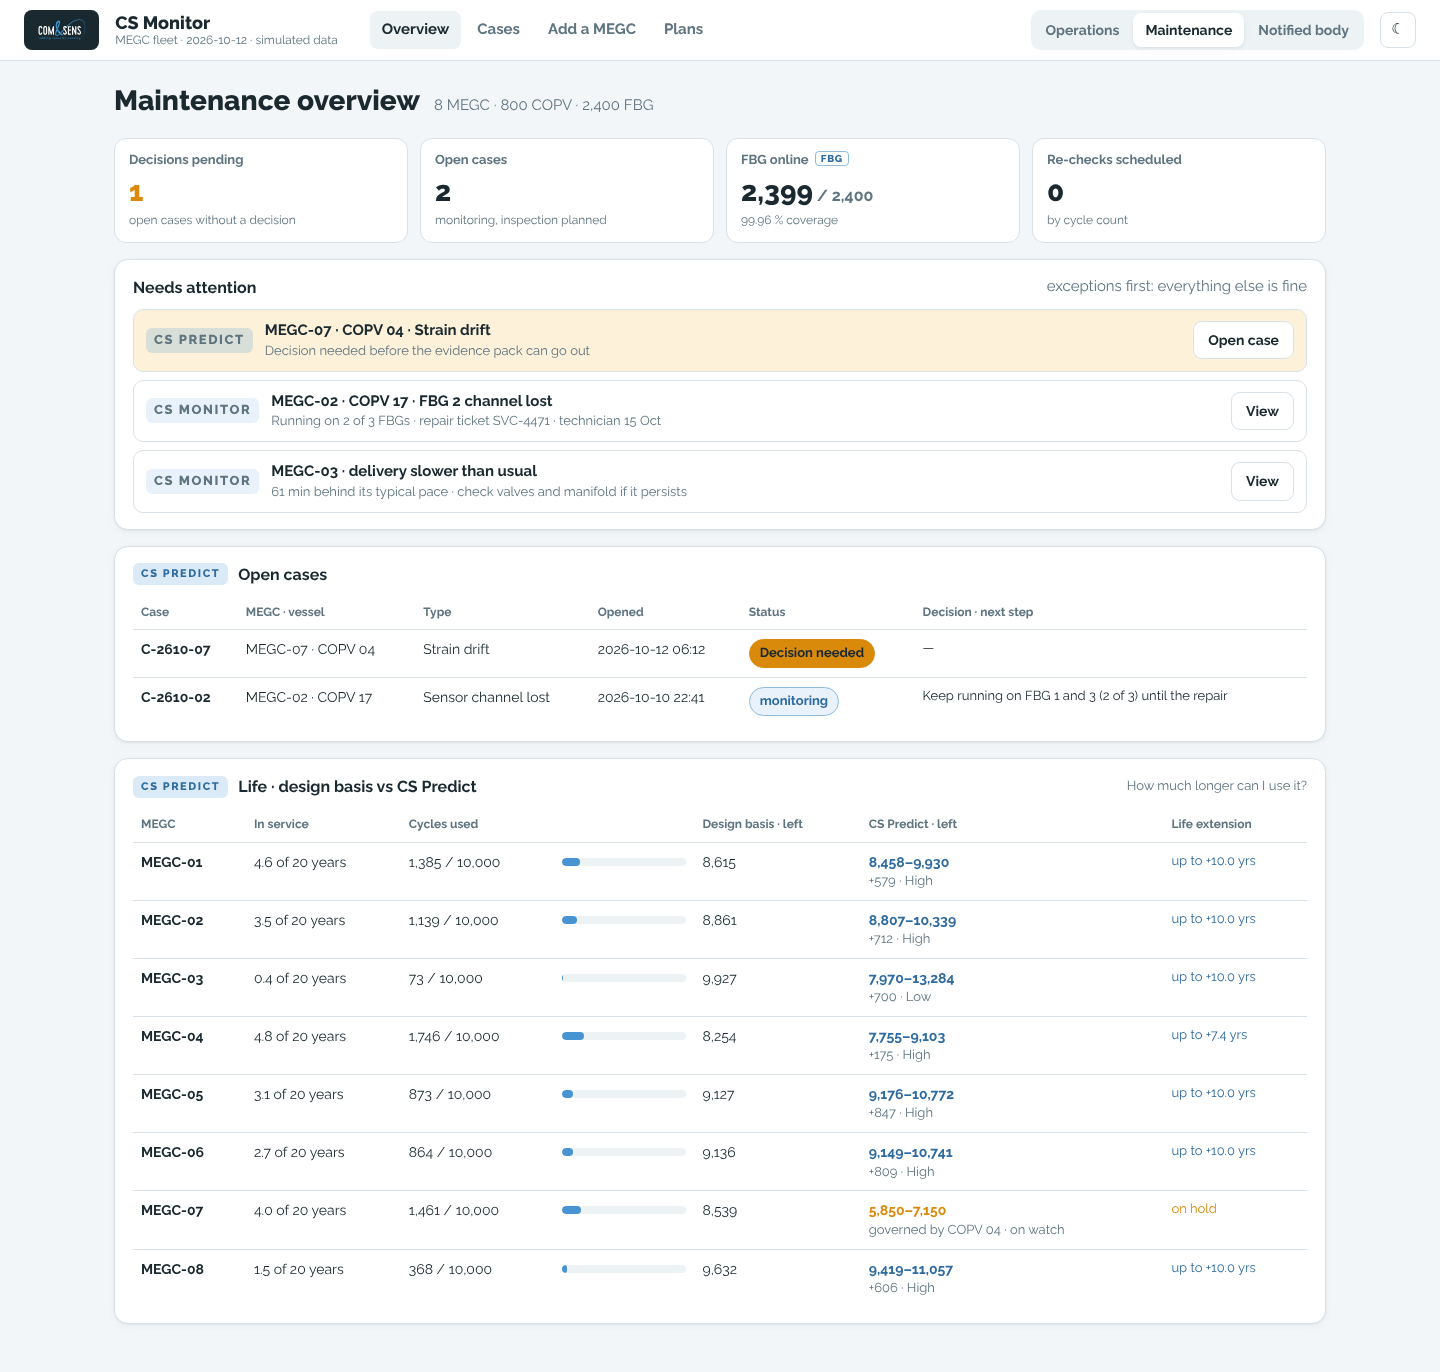
Maintenance view: open cases, re-checks and sensor coverage across the fleet.
Prototype screens with simulated data.
CS MONITOR · IN DEVELOPMENT
CS Monitor Structures
Live load monitoring for civil and steel structures.
- Bridges, tunnels, lock gates, dikes, steel structures. Strain and temperature from CS FSR sensors, on existing structures or cast into new concrete.
- Loads as they happen. Live strain per sensor, thresholds with warning and critical zones, and an event log.
- Your data, through an API. CS Engine stores every measurement and makes it available to your own asset management tools.

DATA LAYER
CS Engine
CS Guard: logging, events, triggering
Reliable logging of high-frequency FBG data, time-synchronized, for deployments of days or years. Filtering, downsampling and triggering at the edge, so less data to send and less to post-process. Custom thresholds per sensor or group, with warning and critical zones and live alarms.
Works with leading interrogators such as Sentea and FBGS. Deployed in long-term SHM projects across sectors.
Datastore: structuring and databasing
Every measurement structured, stored and ready to use. Your data is available through an API: plug it straight into SCADA, digital twins and asset management systems. Or export it as CSV or JSON and hand it over to partners or certification bodies.
FOR R&D
CS Vision
Make sense of your test data.
Web-based FBG data processing and visualization for development and testing. CS Vision turns messy interrogator output (varying sensor counts, shifting columns, missing signals) into clean, structured datasets. Interactive plots, sensor-to-sensor comparisons, trendlines and annotations, and high-quality chart export.
Shaped by COPV development: winding, curing, proof, cycling and burst testing.
Capturing data, following a fleet or predicting lifetime: let us show you what your sensor data can do.